
In Sextas Ímpares #124, I explained this logic with a simple spreadsheet, using real numbers from my agency as an example. Anyone who doesn't do this math before touching the ads manager ends up deciding by feel, comparing lead prices without knowing whether they make sense for their own business.
Define the percentage you're willing to reinvest in acquisition
The percentage you decide to assign to acquisition is the slice of each customer's revenue your structure can give up without compromising salaries, fixed costs and profit. This number doesn't exist in the abstract: it depends on your own delivery costs and real margin, not on some market benchmark.
In the lecture, I explained that share with a simple exercise: imagine hiring someone purely on commission, paid only when they closed a sale. What would be the maximum percentage of that customer's revenue you'd be willing to give that person, forever, for as long as the customer kept paying?
In my agency, that reference value has been 10% of revenue, when there's a referral from a partner. This isn't a universal rule. A business with higher gross margins, like certain digital products, might be able to sustain a bigger percentage. A business with heavy delivery costs, like labor-intensive projects or physical stock, might only be able to sustain a smaller slice. To understand how this decision intersects with team and margin management day to day, it's worth reading the article on growing an online business while managing margin, team and AI.
Calculate the customer's lifetime value
The customer's lifetime value (LTV) is the total an account pays for as long as the business relationship lasts, not just the value of the first invoice. Calculating acquisition based only on the first sale distorts the math in businesses with recurring revenue, because it ignores everything the customer will still pay afterward.
The calculation is simple: average monthly ticket multiplied by the average number of months the customer stays active. In the lecture, I used the agency's six-year history, where the average retention multiple was 13.9 months and the average monthly ticket was around 1,100 euros at the time. Multiplying the two values, the average revenue per contract closed came to 15,290 euros.
If your business is recent and you don't have enough history, it's more prudent to use a shorter window, of 6 to 12 months, instead of inflating the numbers with a retention expectation that hasn't been tested yet. For businesses with a consolidated history of subscriptions or retainers, the real accumulated average is the number you should use.
The customer relationship continues after the first sale. Explore retention in a service business.
Find out the acquisition cost your business can sustain per customer
The target acquisition cost is the amount you can spend to bring in a new customer without compromising the profitability of the contract over time. It comes from applying the reinvestment percentage you defined to the LTV you calculated. It's the line between growing with margin and burning money with no return.
Following the lecture's example: if the average value of a contract over time is 15,290 euros and the decision was to reinvest 10% of that revenue in acquisition, the math is direct:
Target acquisition cost = €15,290 × 10% = €1,529
In other words, in that specific scenario, it would be possible to pay up to 1,529 euros to bring in a new customer. This number tends to scare people who look only at the absolute value without thinking about the whole contract. If the operation bills 15,000 euros over the course of the relationship and delivery is well calculated, paying 1,529 euros for that customer is perfectly sustainable. The real risk isn't in the value itself, but in whether cash flow can handle the gap between spending on advertising now and receiving the monthly payments over the following months.
Apply the conversion rate between lead and customer
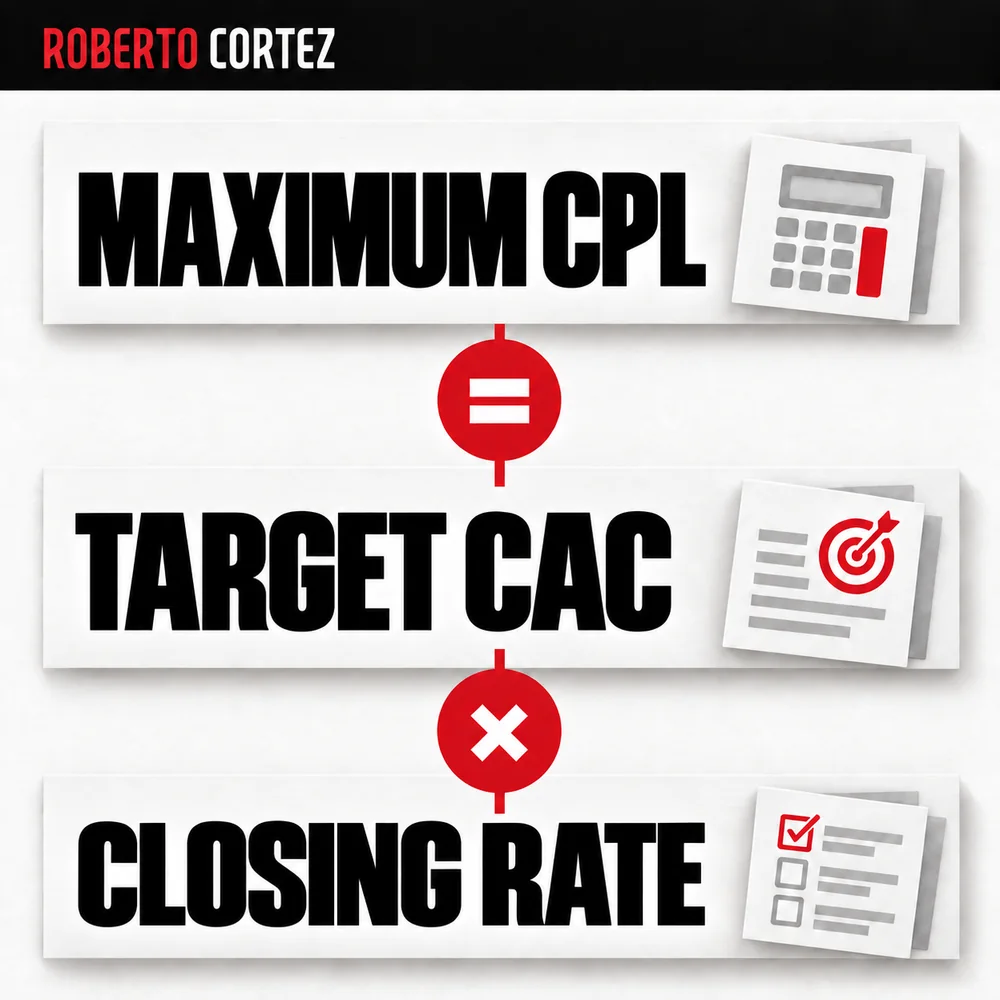
Calculate maximum cost per lead by multiplying target customer acquisition cost by the proportion of leads that become customers, expressed as a decimal. This calculation reveals the maximum price you can pay per lead while keeping profitability intact. A low conversion rate raises real cost per customer, so accurate rate estimates are essential before setting lead budgets.
In the lecture, I showed how closing rate influences cost per lead using a concrete scenario from the agency: on average, it takes 25 leads to close one sale, which gives a conversion rate of 4%.
The calculation to reach the maximum cost per lead is:
Maximum CPL = target acquisition cost × conversion rate
Applying the numbers from the example:
Maximum CPL = €1,529 × 4% = €61.16
In this specific case, paying around 60 euros per lead wasn't expensive, it was simply what the structure allowed. If someone looks at that value without knowing the numbers behind it and decides to pause campaigns because it seems high, they're making a decision without context. To work better on moving these contacts toward the closing meeting, the guide on building a lead funnel the sales team can actually work goes deeper into that part of the process.
Don't judge the campaign by a single lead
With a conversion rate of 4%, most of the contacts generated will never buy, and that's not a sign that something is wrong. In a sample of 25 leads, 24 might fall through without that invalidating the math, as long as the pattern holds across larger batches.
If the sales team receives one unqualified contact and immediately concludes that the traffic doesn't work, they're ignoring the fact that the statistic only confirms itself over reasonable samples, of 50, 100 or 200 contacts. What matters is tracking whether, within that volume, the closing proportion stays close to what's expected.
To reduce time spent on contacts that will never close, it might be worth exploring ways to qualify better before the sales contact, as described in the article on AI in B2B prospecting to qualify opportunities. Likewise, improving sales follow-up can raise the conversion rate without touching the ad budget, as I explain in the article on turning more leads into customers in a service business.
Adjust the value as the numbers change
The maximum CPL isn't fixed forever. Recalculate it whenever conversion rate, average ticket or delivery cost change, since any shift in these factors moves the ceiling your structure can sustain, keeping your spending limit aligned with current business performance and costs.
Some hypothetical scenarios that show how this moves:
- If leads cost less than the calculated ceiling, that doesn't automatically mean guaranteed extra profit, but it can give room to scale the budget with more confidence;
- If the sales conversion rate drops, for example from 4% to 2%, the maximum CPL falls proportionally, even if nothing changed on the advertising side;
- If you decide to reduce the reinvestment percentage in acquisition, the CPL ceiling also drops, even with the same LTV;
- If the average ticket or retention rises, the CPL you can sustain rises too.
Revisit the calculation whenever the closing rate, margin, average purchase value, or retention changes. These are the changes that affect what you can pay to acquire a customer. Keep the assumptions used in the calculation so you can understand, later on, why you changed the budget.
If you need help organizing this kind of calculation for your own business, check out our services for online businesses.