

Understand exactly what cost per click measures
Average cost per click divides advertising expenditure by the number of clicks counted. It shows what you paid, on average, for that interaction within the scope selected. On its own, it does not tell you how many people reached the page, had a suitable interest, spoke to the team or became customers.
Before comparing campaigns, check that you are using the same definition of a click. An interaction with an advertisement may not represent the visit you want to measure. Choose the metric appropriate to your intended destination and keep the same rule across comparisons, so you do not reward a campaign for generating a different interaction.
You also need to define the period and expenditure included. If you compare a promotional week with a week without a promotion, conditions changed beyond the price of traffic. Record those differences and avoid presenting the change in cost per click as a complete explanation of sales performance.
The metric remains useful for identifying changes worth investigating. An increase may justify examining distribution, message or competition without immediately concluding that the campaign deteriorated. A decrease may be favourable, provided it does not come with a meaningful decline in the stages that follow.
To prepare your next step, explore Lead generation for service businesses.
Calculate through to customers, with clear denominators
To connect clicks with customers, follow a defined set of visits long enough for purchases to occur. Advertising cost per customer divides expenditure by customers attributed under the chosen rule. That attribution organises analysis, but it does not demonstrate that advertising caused every sale included in the calculation.
In an entirely hypothetical example, two campaigns each spend €600. The first receives 2,000 clicks and four attributed customers; the second receives 600 clicks and six attributed customers. Cost per click is €0.30 for the first and €1 for the second, while advertising cost per customer is €150 and €100 respectively.
In this simplified example, the proportion of clicks ending in customers is 0.2% for the first campaign and 1% for the second. Dividing cost per click by that rate, expressed as a decimal, produces the same customer cost: 0.30 divided by 0.002 and one divided by 0.01. This relationship requires the same dataset and analysis window.
The exercise does not prove that the second campaign should receive the entire budget. You still need to understand customer value, enquiry maturity and what would happen with greater investment. It shows why the difference between clicks and buyers can reverse a conclusion based only on CPC.
Include enquiry quality and sales work
Traffic also affects the team's time. Many unsuitable enquiries can require screening, replies and proposals without generating a proportionate number of opportunities. To assess that effect, examine suitability, the effort required and movement between stages, using consistent criteria so that an unanswered enquiry is not automatically classified as a poor one.
An enquiry from outside your service area differs from a suitable enquiry left unanswered for three days. Neither may result in a sale, but they require different actions. If both fall into a “poor lead” category, you might change the campaign when you needed to fix assignment or sales follow-up.
Agree with the team on what a qualified enquiry means and record objective reasons when there is no fit. Avoid criteria based solely on the opinion of whoever replied. The process of diagnosing a shortage of leads or sales helps locate the stage needing attention before you change investment.
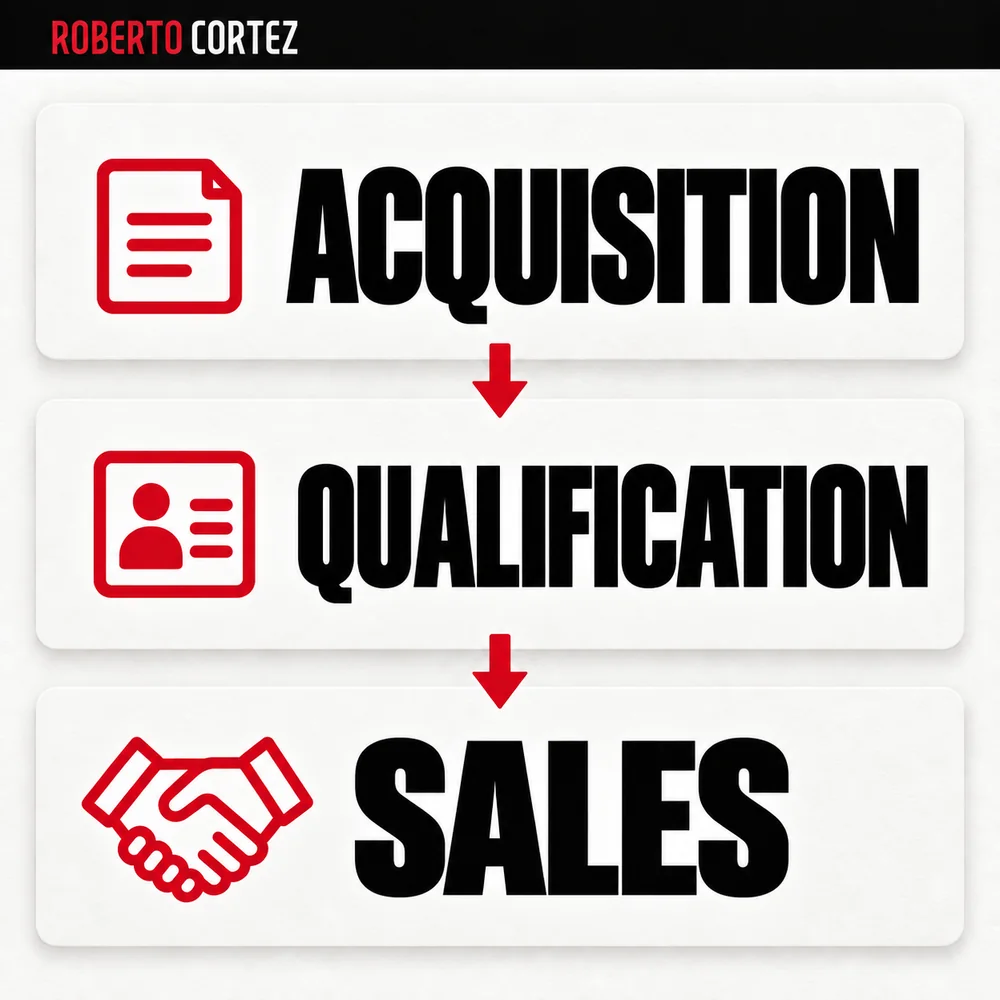
When calculating a fuller acquisition cost, include sales work using an explicit rule. Distinguish variable costs that increase with enquiries from an allocation of the team's fixed costs. Both views can be useful, but they answer different questions and should not be mixed together without an explanation.
Compare the cost with the contribution a sale leaves
A sale can have a high value while leaving little money after the costs required to deliver it. Compare acquisition with the sale's contribution, specifying what has already been deducted. Revenue alone does not show whether there is room for advertising, sales work, overheads and the business's final result.
Continuing the hypothetical example, assume each customer contributes €120 after variable delivery costs, before advertising and sales work. The first campaign's four customers leave €480 on that basis; the second campaign's six leave €720. After deducting €600 of advertising expenditure, the remaining amounts are negative €120 and positive €120 respectively.
Those figures are not net profit. Sales work that has not already been included, overheads and other relevant expenses still need consideration. If the campaigns bring customers with different services, discounts or requirements, you should not even assume the same average contribution without checking the underlying information.
Future purchases can change the assessment, but they require evidence and time. Expected repeat business is not cash received, and recent customers have not yet shown their full behaviour. The criteria for deciding how much to pay for a lead should reflect those differences instead of starting from a universally acceptable price.
Allow time for sales and check record connections
A fair comparison must respect the time people take to buy and the quality of measurement. Comparing recent enquiries with older ones can favour those that had longer to convert. Also check the connection between source, enquiry and sale, identifying duplicates and cases where attribution cannot be considered reliable.
Choose groups of enquiries that can be followed over comparable periods. When a sales process is still open, show that status rather than treating every opportunity as lost. You can monitor intermediate signals, such as completed conversations or suitable proposals, without turning them into customers before a purchase takes place.
Check a sample of real journeys in the sales system. A repeated form can create two records for the same person, and one sale may appear in reports from several channels. Reconciliation reduces counting errors, although it does not, by itself, answer the question of each campaign's causal effect.
It is also useful to track cancellations, returns and payments when they matter to the business model. A recorded order and a paid sale can represent different moments. Keep those states clear so that the apparent customer acquisition cost does not hide transactions that never produced the expected value.
Decide using a small set of connected indicators
To decide on investment, monitor traffic cost alongside suitability, sales conversion and contribution. Choose a few indicators that explain the journey and define which changes warrant investigation. You can then act on the appropriate stage without turning every daily fluctuation in CPC into an instruction to alter the campaign.
If clicks become more expensive while enquiries become more suitable, examine the complete result before reacting. If traffic becomes cheaper and the team receives incompatible requests, review the message, audience and stated conditions. The decision should consider the whole process, including the ability to handle what the campaign generates.
A budget change can be limited while you follow what happens in subsequent stages. Record the hypothesis and criteria for keeping, correcting or stopping the change. The indicators that show whether the business is improving should help assess that decision, using definitions the entire team understands.