
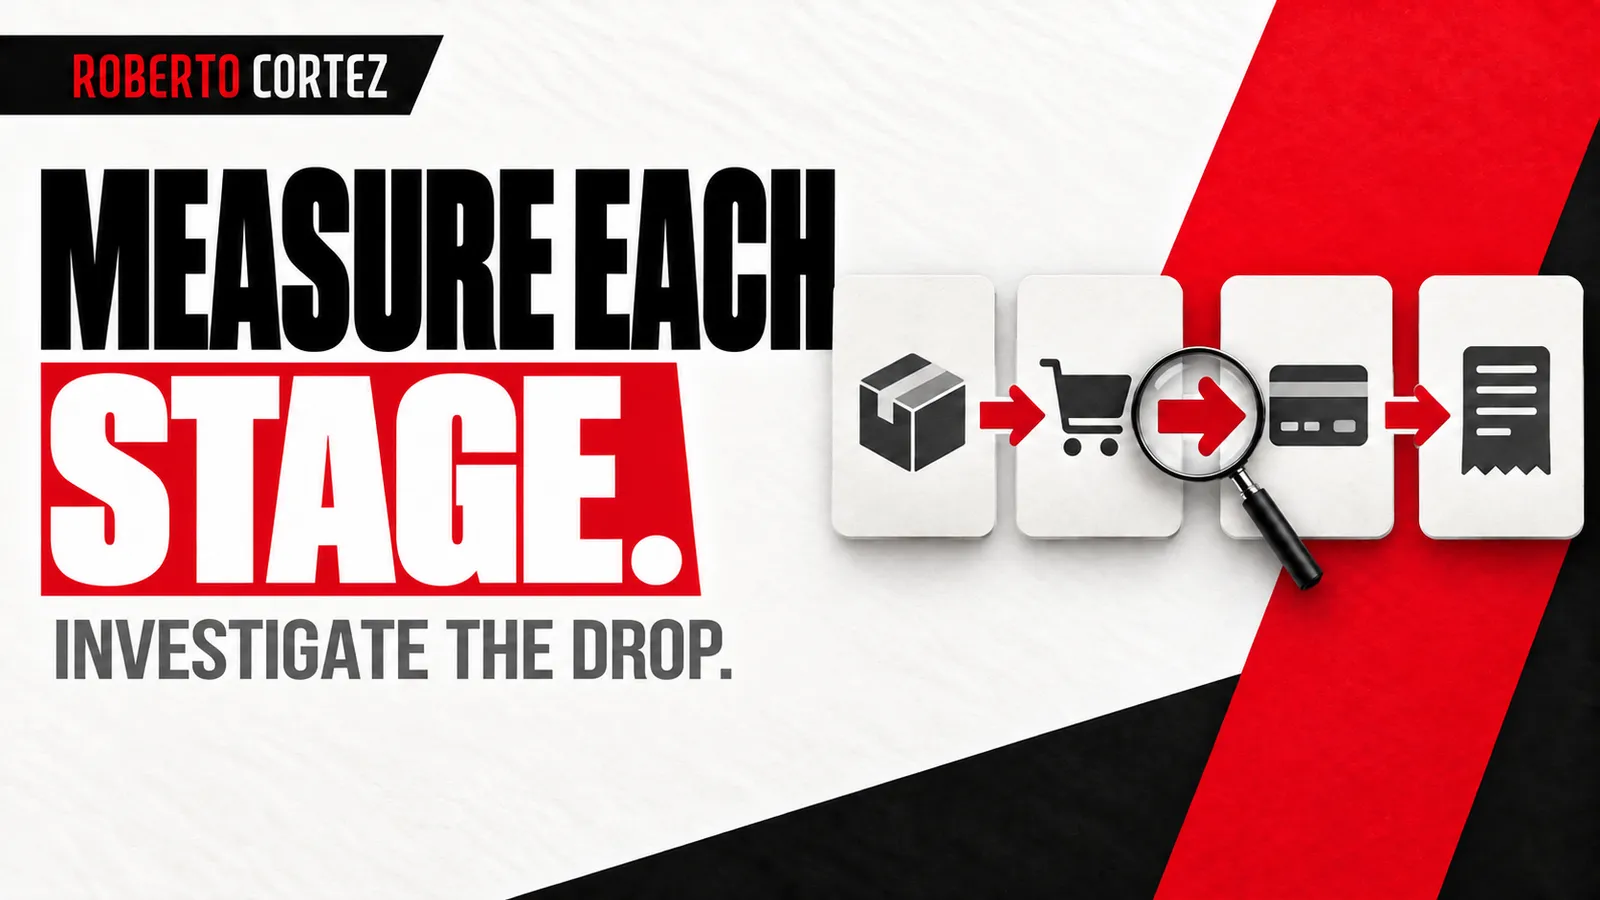
Define the action represented by each stage
Before calculating rates, write down what reaching each stage means in your store. Viewing a product, adding it to the cart, starting checkout and completing a purchase are different actions. Confirm that records correspond to those actions and that similar names are not being used for different events in the journey.
Adding to the cart differs from opening the cart page. Someone may add several products and only inspect the summary afterwards. If the definition changes between reports, the rate can change even when buyers' behaviour remains exactly the same.
Define what counts as a purchase in the report too. An order may have been created while payment remains pending, whereas another is already paid. Choose the state appropriate to the question and make it explicit so a difference in definitions is not interpreted as a payment problem.
This discipline complements choosing the indicators that show whether the business is improving. The final indicator tracks the outcome; stages help determine where to seek an explanation. Both need a definition the team can apply consistently rather than reinterpret each time it produces a report.
To prepare your next step, explore Growing an online store.
Keep the same unit and observation window
A stage rate requires compatible groups, with the same counting unit and clear timing rules. Do not divide purchases by repeated clicks and call the result the percentage of people who bought. Decide whether you follow people identifiable within measurement, sessions or journeys, and explain the limitations associated with that choice.
For this article's hypothetical example, we follow one thousand observed journeys beginning on a product page. Each journey counts once per stage, progresses in the defined order and is followed within the same window. There are no skipped stages or recording failures in this simplified example.
In an actual store, someone may return later, use another device or enter directly at a subsequent stage. Those situations need rules within the analysis. Placing four totals side by side is insufficient grounds to assume they represent exactly the same group progressing in sequence.
Record coverage and possible measurement failures too. A set of observable journeys may not represent every purchase made in the store. Differences between operational data and browsing data should be investigated without inventing movements that you were unable to observe.
Calculate each transition with the correct denominator
In the hypothetical example, one thousand journeys reach the product, two hundred add to cart, one hundred and twenty start checkout and ninety complete purchase. At each transition, divide those who progressed by those reaching the previous stage. The complement of that proportion shows who did not progress within the defined window.
From product to cart, two hundred out of one thousand progress: twenty per cent. Eight hundred do not reach that next stage, or eighty per cent. From cart to checkout, one hundred and twenty out of two hundred progress: sixty per cent; eighty do not, representing forty per cent.
From checkout to purchase, ninety out of one hundred and twenty progress: seventy-five per cent. The remaining thirty represent twenty-five per cent who did not progress through that transition. These figures are illustrative rather than performance benchmarks or results from a store I have worked with.
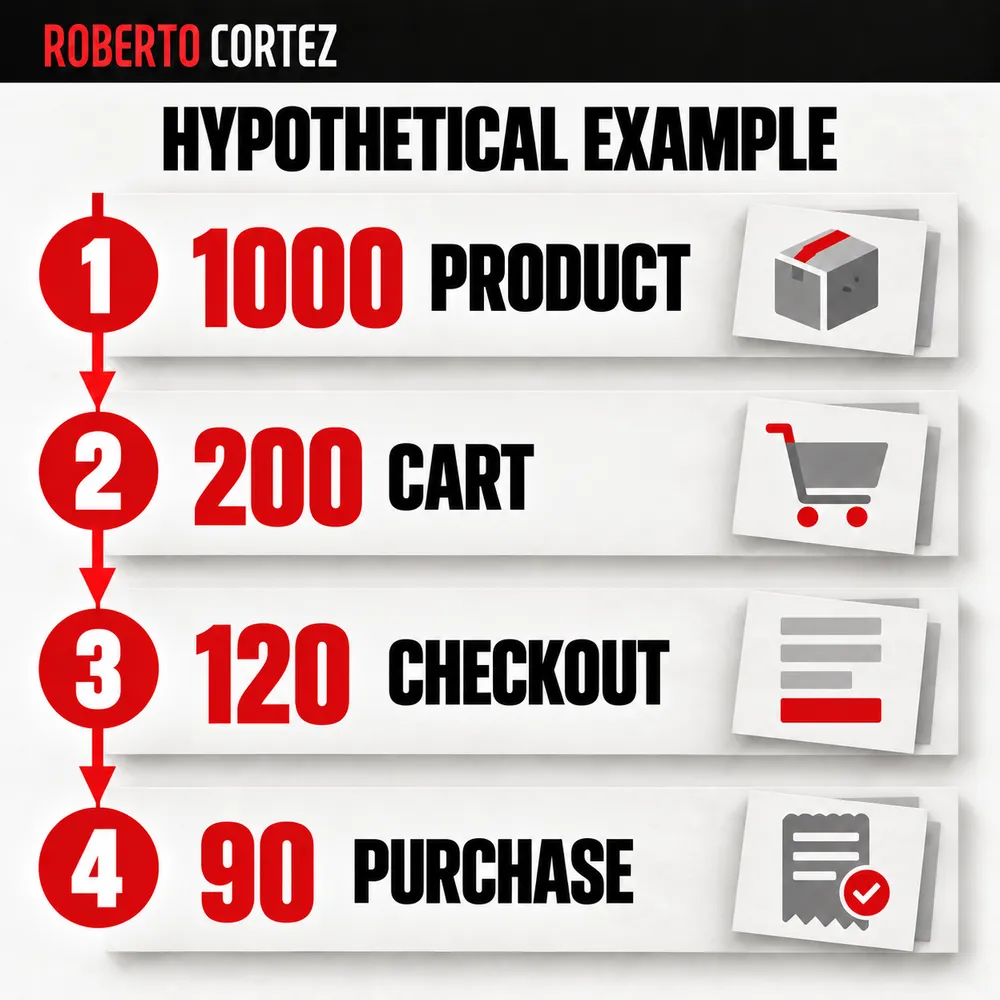
Overall conversion for this group is ninety out of one thousand, or nine per cent. The transition from cart all the way to purchase is ninety out of two hundred, or forty-five per cent. The fifty-five per cent who do not reach purchase from cart include both subsequent transitions, without adding their individual percentages.
Use the drop to ask questions, not declare causes
A difference between stages shows where to seek possible explanations but does not identify the cause without additional information. Limited progression can reflect exploratory intent, unsuitable products, insufficient information or a functional fault. Examine the context and test the journey before selecting a change intended to resolve the observed result.
In the example, the largest loss by volume occurs before the cart. That does not prove the button has a fault or that all those people would buy if you changed the page. Some may be comparing products or assessing whether the offer addresses their needs.
A drop during checkout also has several possible explanations. There may be a reproducible error, a condition discovered late or a change of intent. Combine usage observations, support questions and operational information to distinguish hypotheses supported by evidence from explanations that are merely plausible.
The logic of understanding where sales are stopping helps avoid automatically requesting more traffic. If you find a concrete blockage, fix it and confirm the functional outcome. If you have only a hypothesis, present it as something to test rather than as an established diagnosis.
Compare segments and periods without changing the rules
After understanding the total, look for differences between groups relevant to the decision while keeping stage definitions and periods consistent. Device, product or visit source can help locate a difficulty. Use groups with enough observations to interpret the result and avoid strong conclusions based on only a handful of cases.
A stable total can conceal a fault affecting just one variant or entry route. Conversely, a change in the composition of visits can alter the overall rate without the store deteriorating. Comparing similar groups helps establish what is actually changing underneath the headline result.
Record simultaneous changes to campaigns, prices, availability or site functionality. If several elements changed together, attributing the difference to one intervention becomes harder. The comparison remains informative, but its explanation needs to respect that limitation instead of selecting the most convenient cause.
Do not automatically adopt another company's historical result as a target. Purchase context, catalogue and measurement methods may differ. Progress within your own store, assessed with stable criteria and investigated causes, provides a clearer basis for deciding which work should come next.
Connect analysis to a decision and verify the outcome
A report by stage should end with an action proportionate to the evidence: fix a confirmed fault, investigate a difference or test a hypothesis. Identify an owner, a change and an assessment method. Then follow the complete journey, because improving one transition may simply move the difficulty to the next stage.
If more people add to cart while purchases remain unchanged, investigate what changed afterwards. An increase in an intermediate action alone does not demonstrate more value for the business. It may also represent a less informed choice that will be abandoned later.
Attention to connections between stages, developed in planning a funnel that can actually be worked, applies as a monitoring principle. Ecommerce has different states and actions, but the need for continuity remains. Each stage should have meaning and connect to the outcome you are trying to achieve.
I would use abandonment by stage to choose the next question more precisely. The calculation shows where the journey lost continuity; investigation helps explain why. Separating those two tasks prevents a visually convincing report from becoming a conclusion that the underlying data does not support.